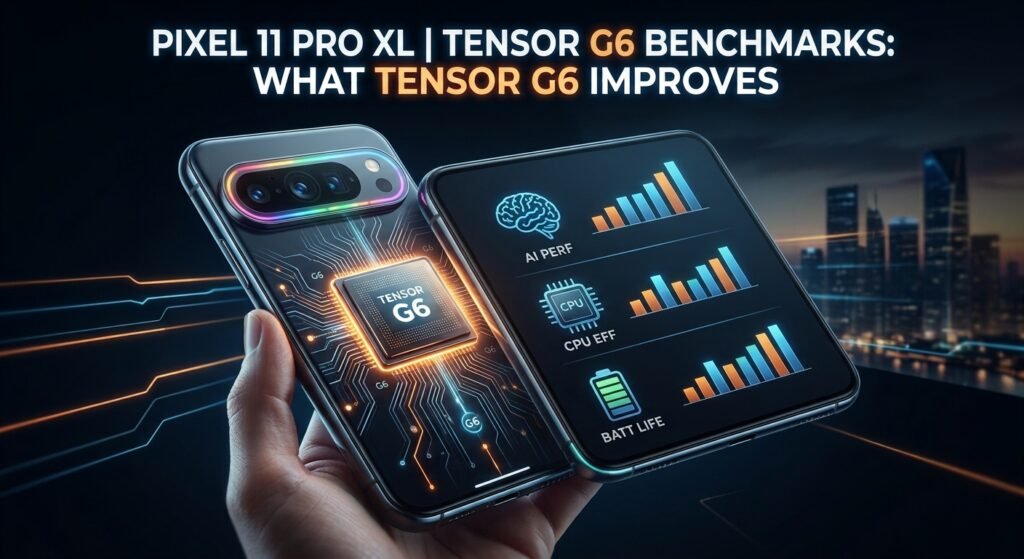
PhoneArena’s published scores show a generational CPU gain for the Pixel 11 Pro XL. This analysis explains the numbers, their limits and why benchmark gains alone do not settle an upgrade decision.
- PhoneArena is the original tester; PhoneSpecX did not run these benchmarks.
- Calculated Geekbench 7 gains versus Pixel 10 Pro XL are 16.4% single-core and 20.1% multi-core.
- Synthetic scores do not establish battery endurance, surface temperature or frame rates in a particular game.
Benchmark summary
Published Pixel 11 Pro XL benchmarks offer a way to examine Tensor G6 under defined workloads. The results below compare CPU scores with the previous Pixel generation and rival flagships.
The Pixel 11 Pro XL uses Tensor G6, according to Google’s announcement. Published measurements offer a useful way to examine one part of that upgrade: its performance under a defined benchmark workload.
This is a research-based analysis of another publication’s results. PhoneSpecX did not run these tests. Scores below are attributed to the original tester, and the percentage changes are our arithmetic applied to those published numbers.
Test source and CPU scores
PhoneArena’s benchmark article labels its CPU results Geekbench 7. It reports these single-core and multi-core scores, respectively:
- Pixel 11 Pro XL: 2,305 / 6,985.
- Pixel 10 Pro XL: 1,981 / 5,816.
- Galaxy S26 Ultra: 3,155 / 10,733.
- iPhone 17 Pro Max: 3,097 / 8,874.
Calculated against the Pixel 10 Pro XL, the Pixel 11 Pro XL gains approximately 16.4% in single-core and 20.1% in multi-core. The calculation is (new score − old score) ÷ old score × 100. These percentages describe this published score comparison, not every application.
What Geekbench measures
Primate Labs describes Geekbench as a cross-platform benchmark with single-core and multi-core CPU tests. Its workloads include application areas such as video conferencing, streaming and game physics.
A single-core result examines a different performance dimension from a multi-core result. Neither is a direct measurement of how quickly every tap produces a visible response. Application design, storage access and network delays can affect a task without appearing in a CPU score.
Compare results from the same benchmark version. A number from an older suite should not be inserted into this list simply because it comes from the same phone family. A changed workload can change the scale, making a superficially neat comparison misleading.
GPU results and their limits
The same PhoneArena article labels its graphics table Steel Nomad Light High and Low. It lists 1,207 / 1,039 for Pixel 11 Pro XL and 1,017 / 910 for Pixel 10 Pro XL. Those labels should remain attached to the numbers; they are benchmark scores, not frames per second in a named game.
UL describes Steel Nomad Light as a demanding graphics workload for phones, tablets and lightweight computers, with a lower rendering resolution and reduced effects relative to Steel Nomad. That makes the exact test name important: Steel Nomad and Steel Nomad Light are not interchangeable labels.
Thermals and sustained performance
A useful sustained-performance assessment needs more than an isolated high score. It should document the workload duration, room temperature, device settings and behavior over repeated runs. Without that context, a lower result cannot be translated confidently into a specific surface temperature or a fixed amount of throttling.
The cited scores alone cannot establish surface temperature or battery drain. The difference between high and low results also needs test-duration and environmental context before drawing a cooling-system conclusion.
For a buyer who plays for long sessions, a time-series test would be more useful than a peak result alone. Look for whether performance settles, how variable it becomes, and whether the test used the same conditions for competing phones.
What the numbers mean for gaming
A synthetic graphics test provides a controlled workload. A game adds its own engine, quality presets, frame-rate limits and update history. The two forms of evidence can complement each other, but one does not replace the other.
Before choosing a phone for a particular game, look for a test that names the title and version, resolution or quality preset, session length and frame-rate behavior. Average frame rate is useful, while a record of unusually slow frames can reveal interruptions that an average conceals.
The evidence presented here cannot promise a locked frame rate in your preferred game. It also cannot establish that camera processing, navigation or ordinary messaging will improve by the same percentage as a CPU benchmark.
Competitors and the upgrade decision
The CPU comparison above puts the competing flagships ahead in this particular dataset. That ranking is useful for a performance-focused shortlist, but it is only one part of a phone purchase. Screen preferences, software features, camera priorities and regional pricing still need their own evidence.
Google’s stated seven-year period for OS and security updates and Pixel Drops is a separate consideration. Long support and a high benchmark score answer different questions: one concerns the manufacturer’s support commitment, while the other measures a workload at a particular point in time.
If you own the previous generation, identify a task that currently feels limiting before assigning value to the new scores. For broader context, see our Pixel 10 Pro XL review and Pixel 10 review. Keeping a satisfactory phone can be reasonable even when a successor scores higher.
Verdict
The published evidence supports a generational CPU improvement, with the strongest conclusion confined to the tests actually identified. It does not justify a universal speed claim or a first-hand gaming verdict from PhoneSpecX.
Use these results to decide what to investigate next. A performance-first buyer should seek sustained workload comparisons; an existing Pixel owner should weigh an observed limitation against the total upgrade cost. Either approach is more useful than treating a single benchmark as a complete ranking of smartphones.
What to Read Next
Frequently Asked Questions
Did PhoneSpecX run the Pixel 11 Pro XL benchmarks?
How much higher are the CPU scores than Pixel 10 Pro XL?
Can I compare these scores directly with Geekbench 6 results?
Do the GPU scores predict game frame rates or battery life?
Sources & References
- PhoneArena: original Pixel 11 Pro XL benchmark results — Original published CPU and GPU measurements; preserve test labels and attribution.
- Google: Pixel 11 Pro and Pro XL announcement — Primary source for Tensor G6 and Google’s software-support commitment.
- Primate Labs: Geekbench benchmark overview — Benchmark developer’s explanation of CPU test scope.
- UL: 3DMark and Steel Nomad Light overview — Benchmark developer’s explanation of Steel Nomad Light; not a source for these phone scores.